


Bertuğ Akıntuğ – Drought Analysis, Stochastic Modeling in Hydrology
A Markov-Switching Model for Annual Hydrologic Time Series Akıntuğ, B., and P. F. Rasmussen (2005). Water Resources Research, 41, W09424, doi:10.1029/2004WR003605.
This paper investigates the properties of Markov switching (MS) models (also known as hidden Markov models) for generating annual time series. This type of model has been used in a number of recent studies in the water resources literature. The model considered here assumes that climate is switching between M states and that the state sequence can be described by a Markov chain. Observations are assumed to be drawn from a normal distribution whose parameters depend on the state variable. We present the stochastic properties of this class of models along with procedures for model identification and parameter estimation. Although, at a first glance, MS models appear to be quite different from ARMA models, we show that it is possible to find an ARMA model that has the same autocorrelation function and the same marginal distribution as any given MS model. Hence, despite the difference in model structure, there are strong similarities between MS and ARMA models. MS and ARMA models are applied to the time series of mean annual discharge of the Niagara River. Although it is difficult to draw any general conclusion from a single case study, it appears that MS models (and ARMA models derived from MS models) generally have stronger autocorrelation at higher lags than ARMA models estimated by conventional maximum likelihood. This may be an important property if the purpose of the study is the analysis of multiyear droughts.

| Figure1: (a) State probabilities and (b) regime shifts for Niagara River annual flows. |
Figure2:Niagara River annual runoff (a) Marginal pdf of two-state MS model. (b) Normal probability plot of observed annual runoff and fitted two-state MS model. |
| Figure3: Niagara River observed and modeled auto-correlation function. |
Simulation of Monthly Flows Using Markov Switching Model Akintug, B., and P. F. Rasmussen (2005). American Geophysical Union (AGU) Meeting, The 2005 Joint Assembly, New Orleans, Louisiana, USA, 23-27 May 2005.
Some hydrologic time series contain extended periods of wet and dry years. In synthetic hydrology, it is important that the characteristics of such cycles be reproduced. Conventional low-order ARMA models may not be able to adequately reproduce observed cycles. Here Markov-Switching (MS) models, also known as hidden Markov models, are explored for generation of monthly streamflow.The objectives of this research are:
-To explore the theoretical properties of MS models
-To develop a disaggregation approach for generating monthly flows based on MS models
MS Disaggregation Model
Using the MS model, 500?138-yr annual flows were generated and disaggregated into monthly flows using the proposed Markov Switching Disaggregation (MSD) model and the traditional Valencia and Shake Disaggregation (VSD) model. In the case of the VSD model, observed flows were transformed into normal using a Box-Cox transformation. After application of the VSD model, disaggregated flows were first back-transformed and then adjusted to sum up to annual flows. No transformation or adjustment is required for the MSD model. Both models were tested for their ability to reproduce the important statistics of the observed flows. All important statistics are very well preserved by the MSD model whereas the VSD model does not preserve the standard deviations and cross-correlations of several months (Figure 1).
A probability plot of 10,000 simulated flows reveal that the adjustment disturbs the marginal distributions in the VSD model. This is illustrated in Figure 2. No adjustment is required in the MSD model.
Conclusion
1- All basic statistical properties of the MS model can be derived analytically using the estimated parameters.
2- In the MSD model, no data transformation and adjustment are required. The model preserves the additive
property and reproduces the marginal distributions and all important statistics well.
3- The MSD model is not parameter parsimonious. Hence, it should be used with caution in multi-site, multi-
period situations.
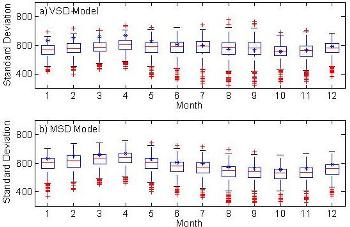
Figure 1: Box plot of simulated monthly standard deviations. The asterisk (?) represents observed standard deviation. 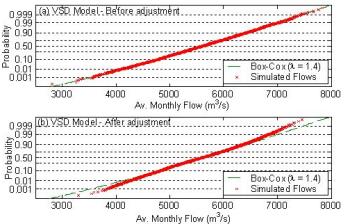
Figure 2:Normal probability plot of simulated January flows using Valencia-Schaake model. (a) Before adjustment procedure, (b) After adjustment procedure
Analysis of Energy Drought Using a Markov Switching Model Akintug B. and P. Rasmussen, 17th Canadian Hydro-technical Conference, Canadian Society for Civil Engineers (CSCE), Edmonton, Alberta, Canada, 17-19 August 2005.
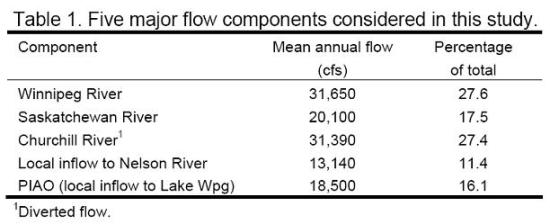
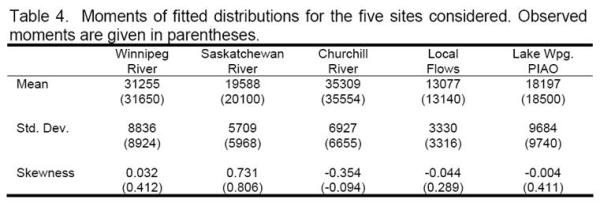
Stochastic time series models are commonly used in the analysis of large-scale water resources systems. In the stochastic approach, synthetic flow scenarios are generated and used for the analysis of complex events such as multi-year droughts. Conclusions drawn from such analyses are only plausible to the extent that the underlying time series model realistically represents the natural variability of flows. Traditionally, hydrologists have favoured autoregressive moving average (ARMA) models to describe annual flows. Here we present a Markov Switching (MS) model (also referred to as a Hidden Markov model) as an alternative to conventional ARMA models. The MS model is applied to Manitoba Hydro’s system. This is only a preliminary application and we focus on the ability of the MS model to preserve key properties of observed annual flows at five sub-watersheds in Manitoba Hydro’s system.The province of Manitoba relies almost entirely (95%) on hydropower. The major hydropower generating stations are located on the Nelson River which drains Lake Winnipeg into Hudson Bay. Lake Winnipeg acts as a huge reservoir that allows for seasonal regulation of the flow of the Nelson River. The total drainage area of Lake Winnipeg is almost one million square kilometers, with the major tributaries being the Winnipeg River and the Saskatchewan River. Since 1977, the majority of the Churchill River flow has been diverted into the Nelson River in order to enhance flow at the generating stations on the lower Nelson River.
The province of Manitoba relies almost entirely (95%) on hydropower. The major hydropower generating stations are located on the Nelson River which drains Lake Winnipeg into Hudson Bay. Lake Winnipeg acts as a huge reservoir that allows for seasonal regulation of the flow of the Nelson River. The total drainage area of Lake Winnipeg is almost one million square kilometers, with the major tributaries being the Winnipeg River and the Saskatchewan River. Since 1977, the majority of the Churchill River flow has been diverted into the Nelson River in order to enhance flow at the generating stations on the lower Nelson River.
We believe that MS models have some interesting properties that should motivate their exploration in drought analyses. Their ability to explicitly model wet and dry cycles should be of considerable value, particularly in drought studies. Such cycles are often observed in historical records and may not be well reproduced by conventional autoregressive models.
Incorporating Parameter and Data Uncertainties in the Analysis of Energy Drought Akintug B. and P. Rasmussen, ASCE-EWRI World Environment and Water Resources Congress, May 12-16, 2008, Honolulu, Hawaii, USA
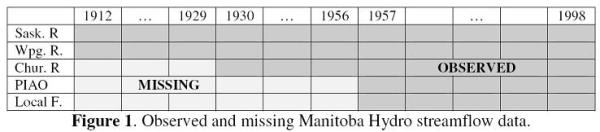
The stochastic approach is commonly employed in the probabilistic analysis of water resources systems. In this approach, a selected stochastic time series model is used to generate synthetic series that mimic the important statistical properties of observed hydrological variables. Due to the use of limited amount of data for model estimation, the estimated parameters have sampling errors. This is usually referred to as parameter uncertainty. In multi-site applications, the length of the observed records at different sites must be the same. In order to use all available data, the shorter series are extended using record extension methods. However, since extended data are not observed values, some data uncertainty is introduced. Although parameter and data uncertainties may have significant impact on the conclusions drawn from a study, they are neglected in most practical applications.
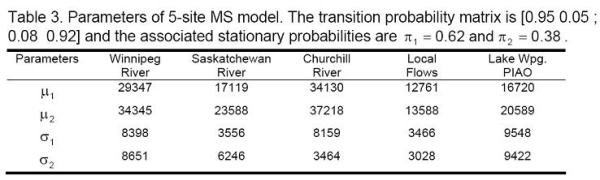
In this study, an attempt is made to integrate and quantify uncertainty associated with parameters and extended data in the frequency analysis of energy drought for Manitoba Hydro, Manitoba, Canada. In the frequency analysis, a multivariate Markov-Switching model is employed in the modelling of annual streamflow data. Parameter uncertainty is then incorporated in the Markov-Switching model through Bayesian inference. In the Bayesian approach, the unknown parameters of the stochastic model are treated as random variables instead of fixed quantities. Parameter uncertainty is quantified by determining the posterior distribution of model parameters. Since the posterior distribution of the parameters cannot be derived analytically for the Markov-Switching model, a Markov chain Monte Carlo (MCMC) method is used to numerically approximate the distribution. In the MCMC method, the extended data are also treated as parameters and simulated along with the model parameters in order to quantify the combined effect of data and parameter uncertainties in the frequency analysis of energy drought.
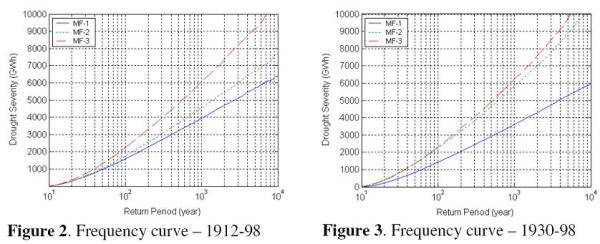
The drought frequency results reveal that different conclusions are obtained when missing data uncertainty is introduced. Figure 2 and 3 shows that when extreme drought events with return periods more than 100 years are considered, there is a significant impact of parameter uncertainty. It can also be seen from Figure 2 that the consideration of missing data uncertainty significantly affects the results of the frequency analysis. Although the 1912-98 data set is relatively long, the frequency analysis shows a significant impact of parameter and missing data uncertainty, especially when considering extreme drought events.